
My Research
There are two theories that together explain all of physics: quantum mechanics and general relativity. Quantum mechanics explains physics at microscopic scales (atoms and molecules) while general relativity deals with physics at large scales (planets and galaxies). These two theories are incompatible. My physics research focused on describing aspects of general relativity using quantum mechanics. More specifically, how applying the theory of quantum mechanics to a very large number of objects can lead to effects that resemble gravity. Some examples:
- The statistical properties of molecules in a gas or atoms in a magnet can be used to describe the structure of black holes.
- The electrical properties of certain materials model the growth of the universe after the big bang.
- Constraints on information storage limit the size and pressure of massive stars.
Some links:
- My thesis in three minutes (for non-specialists)
- My actual thesis: “Geometry from quantum mechanics: entanglement, energy conditions and the emergence of space” (fun fact: alliteration with vowel sounds is called ‘assonance’)
- My publications
Some figures from my papers:
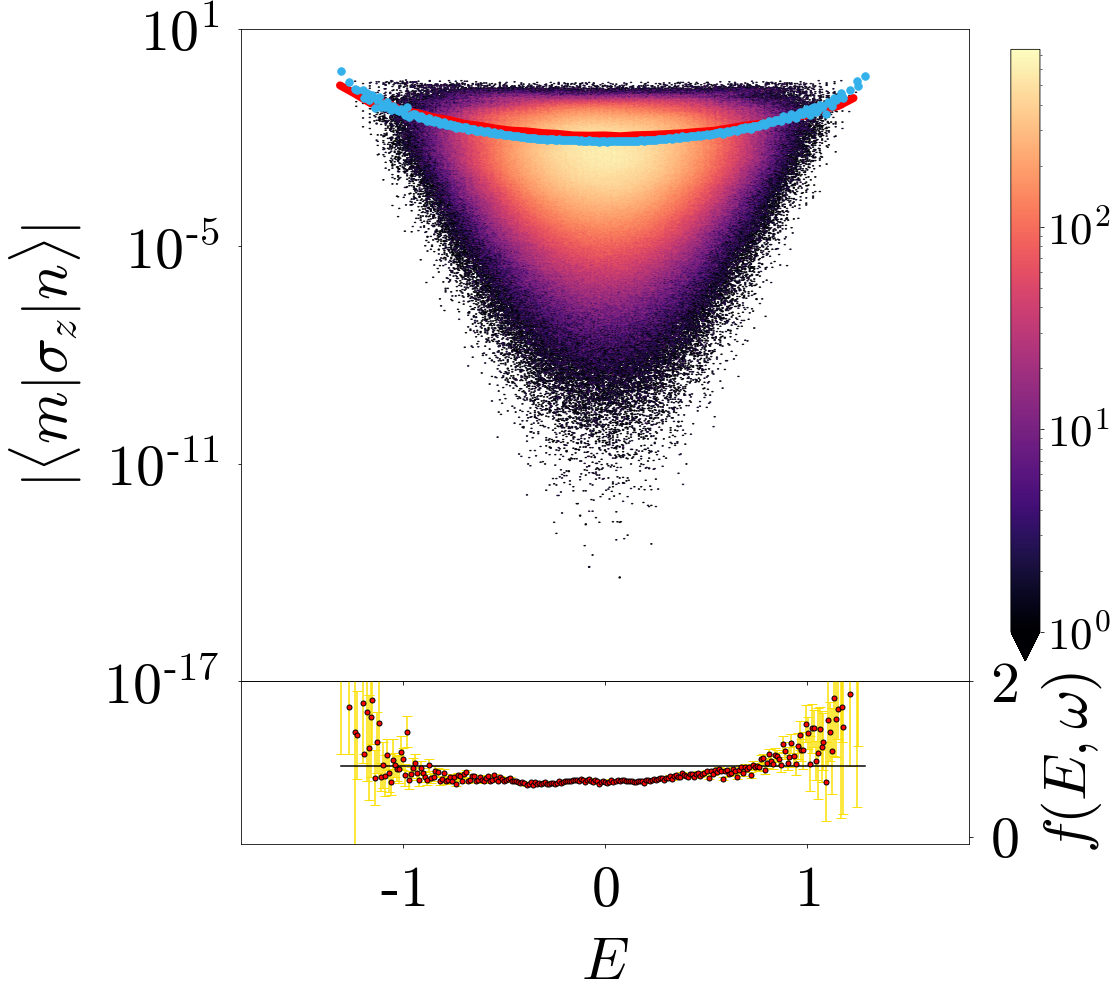
The heatmap shows the density of elements of a particular 213x213 matrix obtained from numerical simulation. The blue points at the top are obtained from a running average, and the red line is a theoretical prediction. The inset displays the difference between the prediction and the measured average: the study of these statistical fluctuations around the horizontal line was used to establish a hidden similarity between ordered and chaotic quantum systems. Simulation done in C++, analysis of data done with numpy, plot with matplotlib. Source
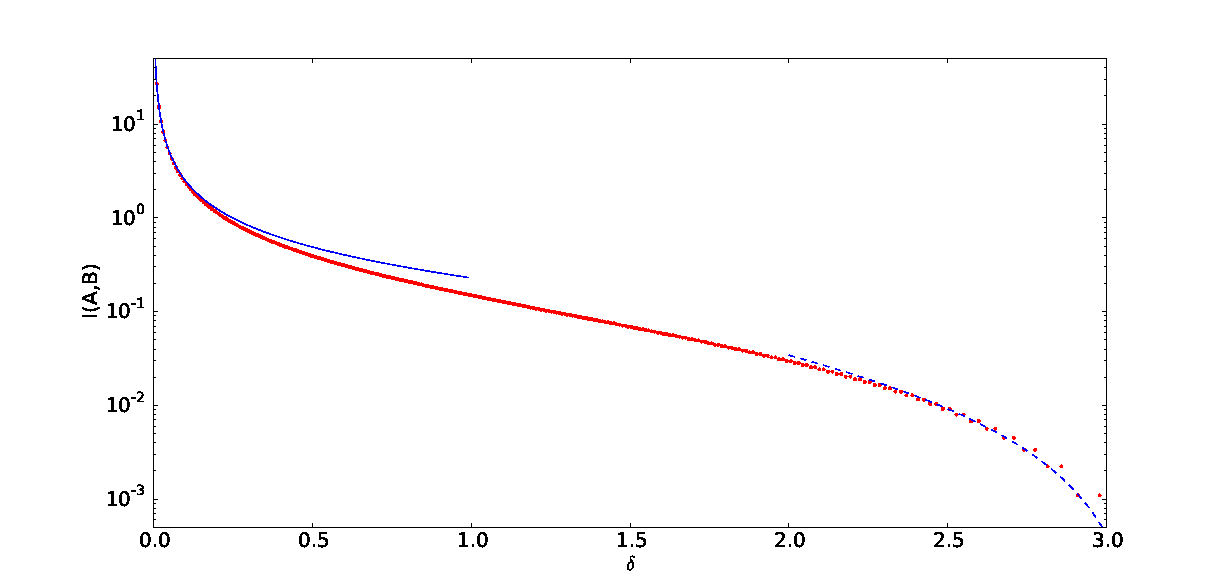
The red points show a quantity called “mutual information” calculated on a “fuzzy sphere”, the quantum version of an ordinary sphere. They were calculated by diagonalizing a particular 300x300 matrix with numpy. The blue lines correspond to theoretical predictions for ordinary spheres, showing agreement between ordinary geometry and quantum mechanics. Plot done with matplotlib. Source
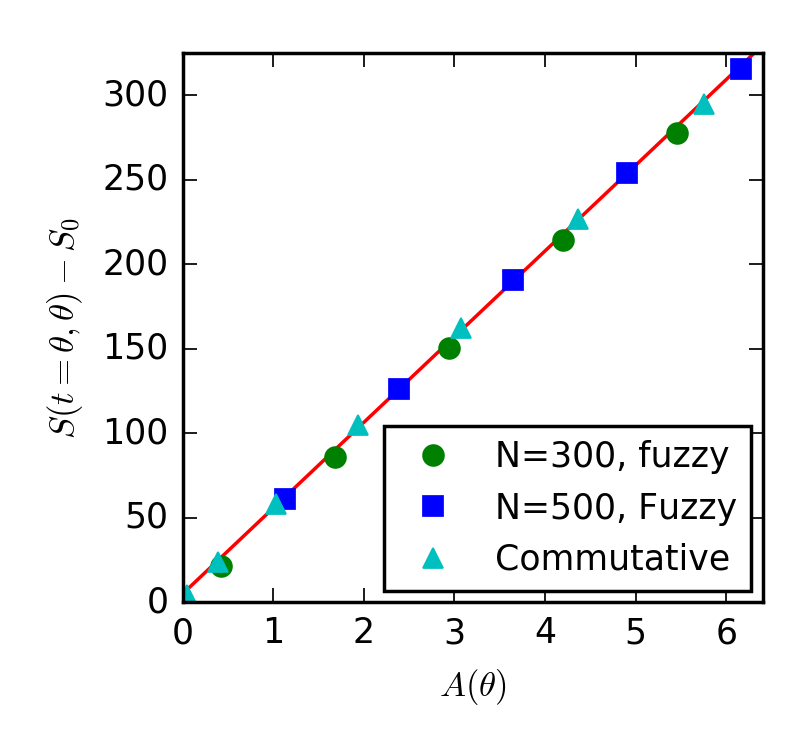
The points show entanglement entropy, a measure of “quantum correlation”, between regions of different areas on an ordinary and a “fuzzy” sphere (the quantum version of an ordinary sphere) after a large injection of energy. The red line is obtained by linear regression and shows that both kinds of spheres can be modelled in the same way. Calculations done with numpy (diagonalizing large matrices), plot with matplotlib. Source
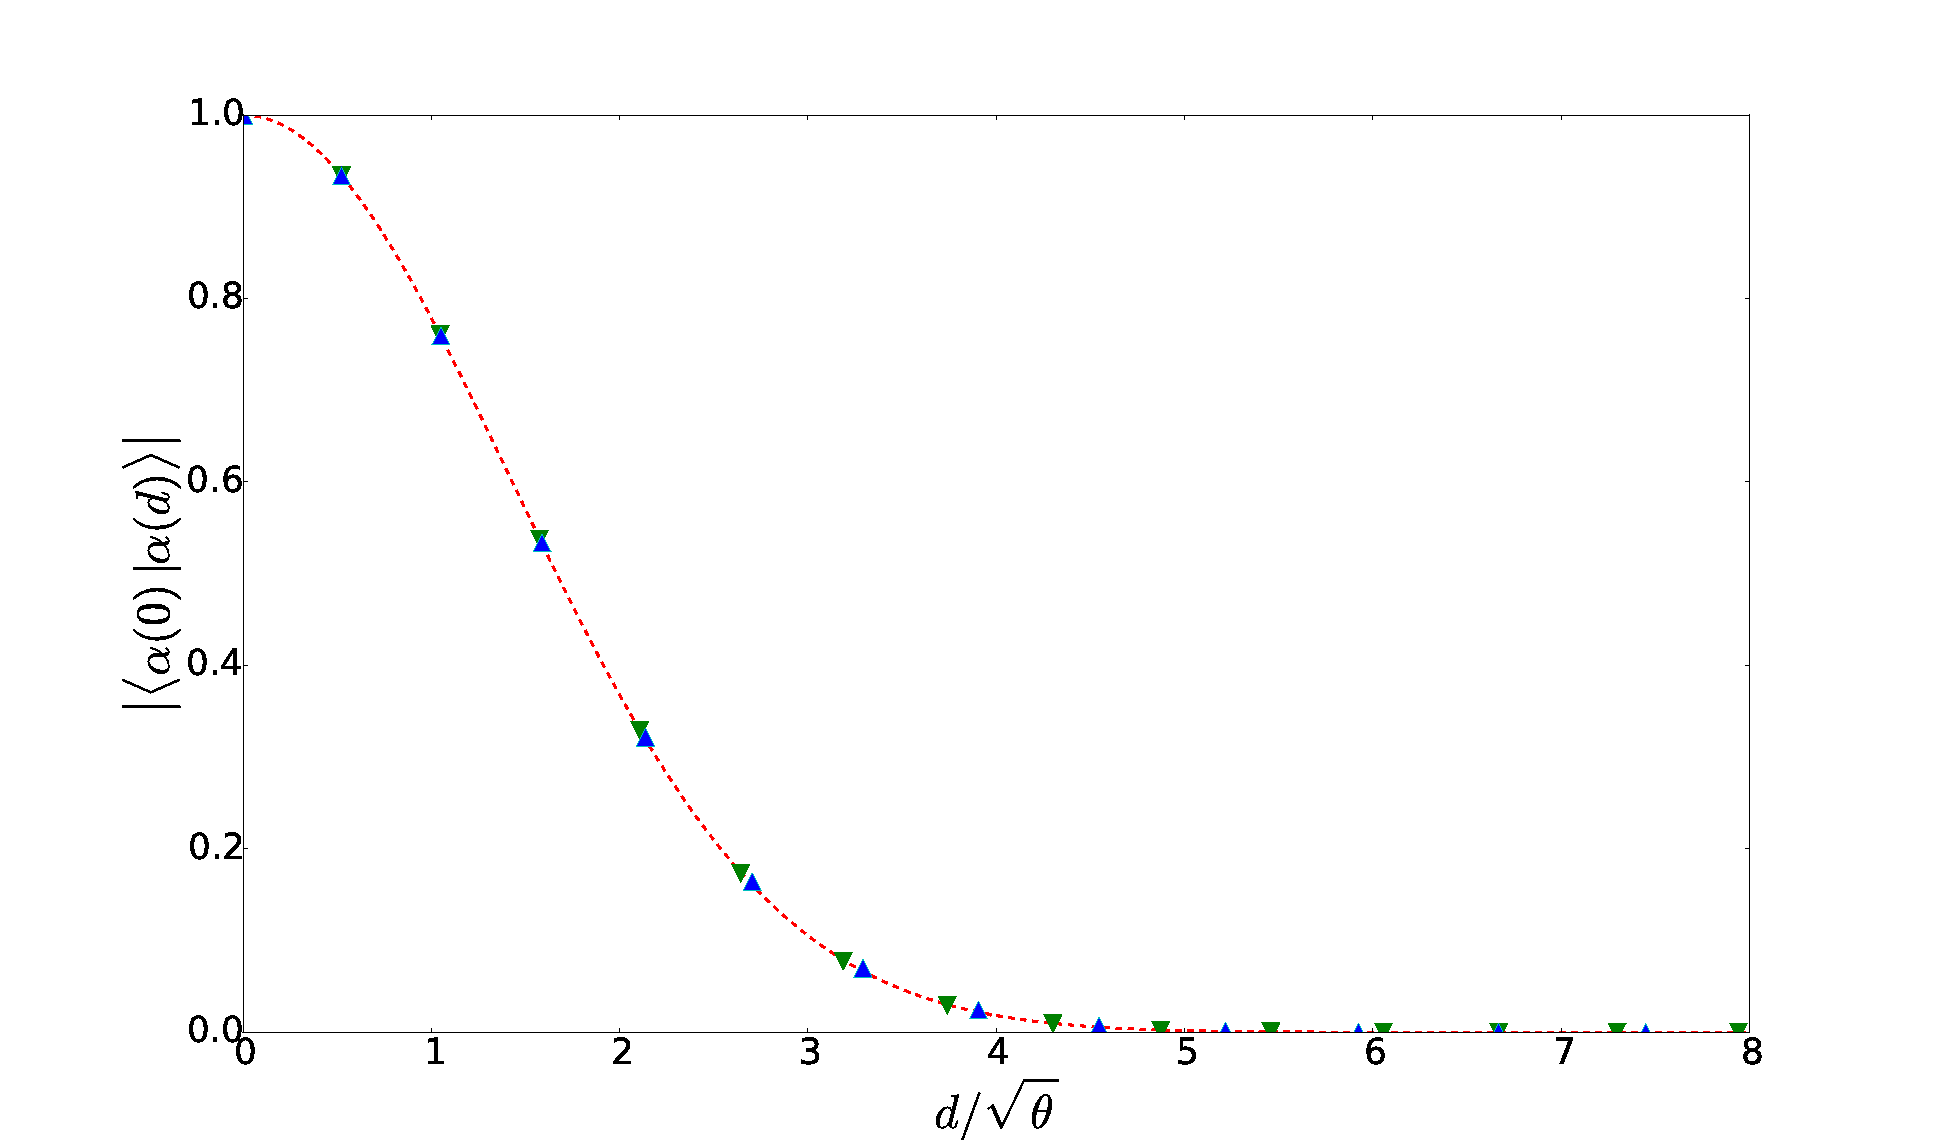
The points correspond to dot product of vectors describing two different points (separated by a distance d) on quantum surfaces. They were calculated by diagonalizing sparse 214-dimensional matrices with numpy. The dashed line corresponds to a normal distribution, which was theoretically predicted to match the points. Source
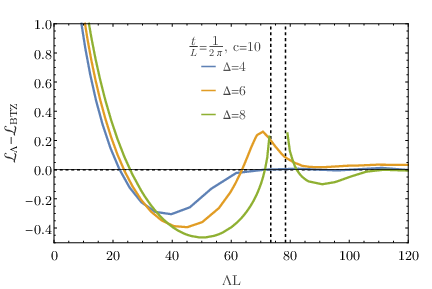
Distance between two sides of a wormhole as measured by different quantum probes. The broken green line indicates that the quantum description of the wormhole breaks down. Calculations and plot done in Wolfram Mathematica. Source